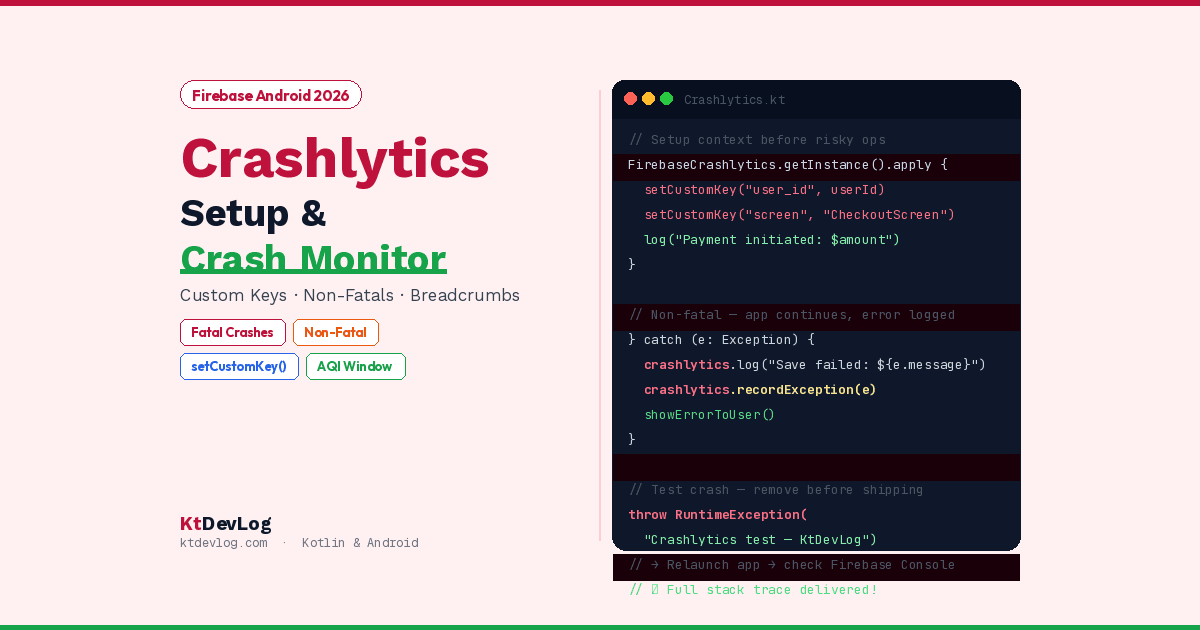

Your app passed every test. You deployed it to the Play Store. And then the one-star reviews start arriving: “keeps crashing,” “crashes on startup,” “crashes when I tap Settings.”
The crash is real. You can’t reproduce it. You have no idea what happened.
This is exactly the gap Firebase Crashlytics fills. It’s a lightweight, real-time crash reporter that runs invisibly inside your published app — collecting crash reports, stack traces, device information, and user actions leading up to every crash, and sending it all to your Firebase Console. When someone’s app crashes in Dhaka at 2am, you wake up to a full crash report with the exact line of code, the Android version, and the steps that led there.

This android app crashlytics setup guide covers everything from the first Gradle plugin to reading your first crash report — including custom keys for debugging context, non-fatal error tracking, breadcrumb logs, ANR detection, and the App Quality Insights window in Android Studio that shows Crashlytics data directly alongside your code.
Table of Contents
What Firebase Crashlytics Monitors
According to the official Firebase Crashlytics documentation, updated April 30, 2026, Crashlytics automatically captures three types of app stability events:
Crashes (fatal exceptions) — unhandled exceptions that cause your app to terminate. The most urgent category. Crashlytics captures the full stack trace, the device state at the time of the crash, and the sequence of events (breadcrumbs) leading up to it.
Non-fatal exceptions — errors your app caught and handled, but that indicate something went wrong. A failed network request that showed an error screen. A Firestore read that returned empty data unexpectedly. These don’t crash the app but hurt the user experience. You log these manually with recordException().
ANRs (Application Not Responding) — Android shows the “App not responding” dialog when your app’s main thread is blocked for more than 5 seconds. ANRs are often worse than crashes from a user experience perspective — the user has to manually kill your app. Crashlytics captures ANRs automatically.
Step 1 — Firebase Project Setup
If you already have a Firebase project from the Firebase Authentication guide, skip to Step 2. If starting fresh:
- Go to console.firebase.google.com
- Create or open your Firebase project
- Navigate to Crashlytics in the left sidebar
- Click Enable Crashlytics
- Recommended: Enable Google Analytics in your project — Crashlytics uses it to generate breadcrumb logs that show user actions leading up to each crash. Without Analytics, you see the crash but not what the user was doing beforehand.
Step 2 — Gradle Configuration
Crashlytics requires both a dependency and a Gradle plugin — this two-part setup is what most tutorials that cause setup failures get wrong.
Project-Level build.gradle.kts
// build.gradle.kts (project level)
plugins {
    id("com.android.application")          version "8.1.4"  apply false
    id("com.google.gms.google-services")   version "4.4.4"  apply false  // Google services plugin
    id("com.google.firebase.crashlytics")  version "3.0.7"  apply false  // Crashlytics Gradle plugin
}Both google-services 4.4.4+ and Crashlytics plugin 3.0.7 are the current 2026 stable versions. The Crashlytics Gradle plugin is separate from the Firebase SDK — it handles symbol mapping file uploads so your crash stack traces are readable after R8/ProGuard obfuscation.
App-Level build.gradle.kts
// build.gradle.kts (app level)
plugins {
    id("com.android.application")
    id("com.google.gms.google-services")   // Apply Google services
    id("com.google.firebase.crashlytics")  // Apply Crashlytics plugin
}

android {
    // ...
    buildTypes {
        debug {
            // Disable Crashlytics in debug builds to keep build times fast
            configure<com.google.firebase.crashlytics.buildtools.gradle.CrashlyticsExtension> {
                mappingFileUploadEnabled = false
            }
        }
        release {
            isMinifyEnabled = true
            isShrinkResources = true
            proguardFiles(
                getDefaultProguardFile("proguard-android-optimize.txt"),
                "proguard-rules.pro"
            )
            // Crashlytics uploads mapping file automatically in release builds
            // This is what makes obfuscated stack traces human-readable
        }
    }
}

dependencies {
    // Firebase BoM — manages all Firebase library versions
    implementation(platform("com.google.firebase:firebase-bom:34.12.0"))
    implementation("com.google.firebase:firebase-crashlytics")
    implementation("com.google.firebase:firebase-analytics")  // Required for breadcrumb logs
}Why disable Crashlytics in debug builds? The Crashlytics Gradle plugin uploads symbol mapping files during every build — a network operation that slows down your build times during development. mappingFileUploadEnabled = false in debug skips this upload while keeping full Crashlytics functionality in your release build where it matters.
Step 3 — Verify the Setup: Force a Test Crash
After syncing your project, force a test crash to confirm Crashlytics is receiving reports. Add this to a button or composable during initial setup — remove it before shipping:
// Temporary test crash — REMOVE before publishing
Button(
    onClick = {
        throw RuntimeException("Crashlytics test crash — KtDevLog setup verification")
    }
) {
    Text("Test Crash (Remove Before Release!)")
}Or using the Crashlytics API directly:
FirebaseCrashlytics.getInstance().apply {
    log("Test crash initiated")
    throw RuntimeException("Crashlytics test crash")
}Testing process:
- Build and install the app on a real device or emulator
- Trigger the test crash — app closes
- Relaunch the app — this is the critical step most developers miss. Crashlytics sends the crash report on the next app launch, not immediately at crash time
- Wait 5 minutes
- Check Firebase Console → Crashlytics — your test crash should appear
If nothing appears after 10 minutes, check that google-services.json is in your app/ directory and both Gradle plugins are applied correctly.
Step 4 — Custom Keys: Add Debugging Context
Raw stack traces tell you where a crash happened. Custom keys tell you what was happening in your app when it crashed — the context that makes a crash actually debuggable.
// Set custom keys before a risky operation
// These appear alongside every crash report in the Firebase Console
fun setupCrashlyticsContext(userId: String, userPlan: String) {
    FirebaseCrashlytics.getInstance().apply {
        setCustomKey("user_id",      userId)        // Which user was affected
        setCustomKey("user_plan",    userPlan)       // "free" or "premium"
        setCustomKey("app_version",  BuildConfig.VERSION_NAME)
        setCustomKey("screen",       "HomeScreen")   // Update as user navigates
        setCustomKey("api_endpoint", "/api/courses") // Which endpoint was being called
        setCustomKey("theme",        "dark")
    }
}Custom keys appear in a “Keys” section on every crash report in the Firebase Console. When you see 47 crashes of the same type, you can filter by user_plan = "free" to see if the crash only affects free users — which immediately narrows your debugging scope.
Custom key rules:
- Max 64 key-value pairs per report
- Keys and values must be under 1KB each
- Use snake_case for key names — consistent naming makes filtering reliable
- Never include passwords, tokens, or personal identifiable information as custom key values
// Update the screen key as the user navigates between screens
@Composable
fun ProfileScreen() {
    LaunchedEffect(Unit) {
        FirebaseCrashlytics.getInstance().setCustomKey("screen", "ProfileScreen")
    }
    // ... rest of composable
}Step 5 — Breadcrumb Logs: Trace the Path to the Crash
Custom logs create a chronological trail of events leading up to a crash. Think of them as breadcrumbs — when you open a crash report, the log section shows the last actions that ran before the crash:
class CourseRepository {

    private val crashlytics = FirebaseCrashlytics.getInstance()

    suspend fun loadCourses(): Result<List<Course>> {
        crashlytics.log("CourseRepository.loadCourses() called")

        return try {
            val response = apiService.getCourses()
            crashlytics.log("API response received: ${response.size} courses")

            Result.success(response)

        } catch (e: IOException) {
            crashlytics.log("Network error in loadCourses: ${e.message}")
            Result.failure(e)
        }
    }
}

class CourseViewModel : ViewModel() {

    private val crashlytics = FirebaseCrashlytics.getInstance()

    fun loadCourseDetail(courseId: String) {
        crashlytics.log("Loading course detail for id: $courseId")
        crashlytics.setCustomKey("course_id", courseId)

        viewModelScope.launch {
            try {
                val course = repository.getCourseById(courseId)
                crashlytics.log("Course detail loaded: ${course?.title}")
            } catch (e: Exception) {
                crashlytics.log("Failed to load course $courseId: ${e.message}")
                // Even if we handle this, the log survives if a crash happens later
            }
        }
    }
}Breadcrumb logs appear in your crash report as a chronological list — the last log before the crash is at the bottom. In a crash report that says “NPE on line 47 of CourseDetailScreen,” the logs might show:
→ CourseRepository.loadCourses() called
→ API response received: 12 courses
→ Loading course detail for id: course_null
→ [CRASH] NullPointerException at CourseDetailScreen.kt:47
That course_null ID in the log is your answer. You’re crashing because a null course ID is being passed from the list to the detail screen.
Step 6 — Non-Fatal Exception Tracking
Not every problem crashes your app — but errors that show users an error screen or silently fail are still worth monitoring. recordException() sends these to Crashlytics as non-fatal events:
class FirebaseRepository {

    private val crashlytics = FirebaseCrashlytics.getInstance()

    suspend fun saveUserProfile(profile: UserProfile): Result<Unit> {
        return try {
            FirebaseFirestore.getInstance()
                .collection("users")
                .document(profile.uid)
                .set(profile)
                .await()
            Result.success(Unit)
        } catch (e: Exception) {
            // Record non-fatal — the app continues, but we know something went wrong
            crashlytics.log("Failed to save profile for uid: ${profile.uid}")
            crashlytics.recordException(e)
            Result.failure(e)
        }
    }
}Non-fatal exceptions appear in a separate section of your Crashlytics dashboard with their own priority ranking. This lets you see — for example — that your Firestore save is failing for 3% of users even though your app never crashes, which you’d never discover from crash reports alone.
Fatal vs non-fatal in practice:
| Situation | Use |
|---|---|
| Unhandled exception — app crashes | Automatic — Crashlytics captures it |
| Exception you caught — showed error UI | recordException(e) |
| Important state change — not an error | log("message") |
| Context for debugging | setCustomKey("key", value) |
Step 7 — User Identifier
Associate crash reports with specific users to understand impact and reach out if needed:
// Set when user logs in
fun onUserLoggedIn(userId: String) {
    FirebaseCrashlytics.getInstance().setUserId(userId)
}

// Clear when user logs out
fun onUserLoggedOut() {
    FirebaseCrashlytics.getInstance().setUserId("")
}setUserId() appears in crash reports as a searchable field. When a user reports a crash in a review or support email, you can search Crashlytics by their user ID and immediately pull up every crash they experienced — timing, device, stack trace, everything.
Privacy note: Use your internal user ID (a UUID or Firestore document ID), never their email address or real name. Keep Crashlytics data anonymised as a best practice, especially for GDPR compliance in EU markets.
Step 8 — Opt-In Reporting (GDPR Compliance)
By default, Crashlytics automatically collects crash reports. For apps targeting EU users or users who prefer explicit consent, you can disable automatic collection and let users opt in:
// Disable automatic collection in AndroidManifest.xml
// <meta-data android:name="firebase_crashlytics_collection_enabled" android:value="false" />

// Enable only after user consent
fun enableCrashlyticsAfterConsent() {
    FirebaseCrashlytics.getInstance().setCrashlyticsCollectionEnabled(true)
}

// Disable if user withdraws consent
fun disableCrashlytics() {
    FirebaseCrashlytics.getInstance().setCrashlyticsCollectionEnabled(false)
}Once setCrashlyticsCollectionEnabled(false) is called, Crashlytics stops collecting data immediately. It also deletes any unsent crash reports. Pair this with your app’s privacy settings screen — a toggle labeled “Help improve this app by sending crash reports” — and you have a GDPR-compliant crash collection setup.
Step 9 — App Quality Insights in Android Studio
One of the most useful 2026 features that most developers don’t know exists: the App Quality Insights (AQI) window in Android Studio shows Crashlytics crash reports directly inside the IDE — no context switching between your code and the Firebase Console.
Android Studio → View → Tool Windows → App Quality InsightsIn the AQI window, you can:
- See your top crashes ranked by number of affected users
- Click any stack frame in a crash report — Android Studio jumps to the exact line of code in your project
- Filter by app version, Android version, and date range
- Mark issues as “Open,” “Closed,” or “Won’t fix” directly from the IDE
- Link crashes to your version control to see which commit introduced the crash
This is the developer experience that makes Crashlytics genuinely useful after the initial setup — not just a data collection tool, but a debugging workflow integrated into your development environment.
Reading Your First Real Crash Report
When Crashlytics captures a crash from a real user, the report contains:
Stack trace — the exact exception type, message, and every method call leading to the crash. R8 obfuscation is automatically reversed using the mapping file the Crashlytics Gradle plugin uploads.
Keys section — all custom keys you set, showing the state of your app at crash time.
Log section — your breadcrumb logs in chronological order, showing the path to the crash.
Device info — Android version, device manufacturer and model, available RAM, disk space.
User section — your setUserId() value if set.
Session — how long the user had the app open before the crash.
Crashlytics also groups similar crashes automatically. Instead of 1,000 individual crash reports for the same NPE on line 47, you see one issue with “1,000 occurrences, 450 users affected.” This prioritisation is what makes crash monitoring actionable rather than overwhelming.
Common Crashlytics Setup Mistakes
Forgetting to relaunch the app after a test crash. Crashlytics batches and sends crash reports on the next app launch — not immediately. If you trigger a crash and check the Firebase Console instantly, you see nothing. Relaunch the app, wait 5 minutes, then check.
Relying only on crash reports and ignoring non-fatals. The crashes you see in Crashlytics are the tip of the iceberg. For every crash, there are likely 10x more non-fatal errors that silently degrade the user experience. Instrument your critical paths with recordException().
Not disabling Crashlytics in debug builds. The Crashlytics plugin uploads mapping files during every build. In debug mode, this adds unnecessary time to every build. Set mappingFileUploadEnabled = false in debug to keep your development workflow fast.
Including sensitive data in custom keys. Custom keys appear in your Firebase Console and are visible to every developer on your project. Never log passwords, authentication tokens, credit card numbers, or personal data.
Not enabling Google Analytics. Without Google Analytics enabled in your Firebase project, Crashlytics captures crashes but has no breadcrumb data — you see the crash but not what the user was doing. Enable Analytics during project setup.
Frequently Asked Questions
Crashlytics Setup
What is Firebase Crashlytics and why do I need it for my Android app?
Firebase Crashlytics is a real-time crash reporting tool that runs inside your published app. When a crash occurs on any user’s device, Crashlytics captures the full stack trace, device information, custom keys you’ve set, and breadcrumb logs showing what the user was doing before the crash — and sends it to your Firebase Console. Without Crashlytics, you only discover crashes when users leave bad reviews. With it, you often know about and fix crashes before most users encounter them.
Why do I need both the firebase-crashlytics SDK and the Crashlytics Gradle plugin?
The SDK (firebase-crashlytics) handles crash capture at runtime — it intercepts unhandled exceptions, captures stack traces, and sends reports to Firebase. The Gradle plugin (com.google.firebase.crashlytics) handles build-time tasks — primarily uploading the R8/ProGuard mapping file that lets Crashlytics translate obfuscated method names back to their original names in crash reports. Without the Gradle plugin, release build crash stack traces show obfuscated names like a.b.c() instead of CourseDetailScreen.loadCourse().
How long does it take for a crash to appear in the Firebase Console?
Crashlytics sends crash reports on the next app launch after a crash occurs — not immediately. After relaunching the app, reports typically appear in the Firebase Console within 5 minutes. For the App Quality Insights window in Android Studio, the sync interval is slightly longer. If you’re testing with a new integration, force a crash, close the app, reopen it, wait 5 minutes, then check the Console.
Custom Logging
What is the difference between log(), setCustomKey(), and recordException() in Crashlytics?
log("message") adds a timestamped message to the breadcrumb trail — it appears in crash reports to show what your code was doing before the crash. setCustomKey("key", value) stores a key-value pair that describes your app’s state and appears in the Keys section of every crash report. recordException(throwable) manually reports a caught exception as a non-fatal error — the app doesn’t crash, but Crashlytics records the exception, stack trace, and all current logs and keys, making it visible in the non-fatal section of your dashboard.
Conclusion
Android app crashlytics setup is a one-time investment that pays dividends every time you ship an update. The setup takes under an hour. The data it provides — exact crash locations, affected user counts, device breakdowns, breadcrumb trails — turns the impossible job of debugging production crashes into a structured, solvable process.
The key things that separate a useful Crashlytics setup from a bare-minimum one: custom keys that give context to every crash, breadcrumb logs that trace the path to the failure, non-fatal recording for errors that don’t crash but hurt users, and the App Quality Insights window that brings crash data into your IDE.
Ship with Crashlytics active. Check your dashboard after every release. Fix the top crash before the second release. In three release cycles your crash rate drops significantly — and your app ratings tend to follow.
Once Crashlytics is catching crashes, pair it with the Android Studio Logcat filter guide for debugging crashes locally during development — the two tools together give you full visibility from development to production.
You can’t fix what you can’t see. Crashlytics makes everything visible.